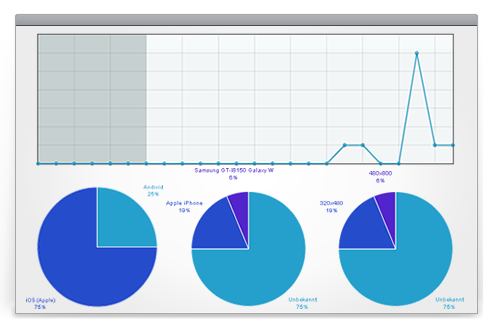
QR statistics show your campaign results
The ease of QR codes use makes no sense without the ability to evaluate such use. Only if you can measure the behavior of your customers during your QR campaign, you will have practical value and will be one step ahead of your competition.
QR statistics and QR tracking from QRtool.de offer you a wide range of opportunities.
Temporal analysis
- Accesses over the last 24 hours
- Accesses over the last 7 days
- Accesses over the last 30 days
- Accesses since the campaign initiation
Geographic analysis
- Accesses by country
- Accesses by city/town
Technical analysis
- Accesses by input device
Benefits for you and your clients
Among other opportunities, the geographical analysis of your QR campaign will help you determine the places of posters, customer stoppers and flyers. With QRtool.de for the first time you have the opportunity to evaluate your print campaign meaningfully, timely and cost-effectively, and thus optimize the next step.


